
Appearance
Troubleshooting Servers
This article describes how to troubleshoot high CPU usage or memory leaks in the game server.
This article describes how to troubleshoot high CPU usage or memory leaks in the game server.
This guide contains instructions for troubleshooting high server CPU usage and memory leaks from the game server using various diagnostic tools.
We'll go over how to interact with Metaplay-managed cloud environments, such as connecting to the Kubernetes cluster and retrieving files from the cloud. This page also covers .NET Performance Counters, which are a great starting point to find possible problems. We'll also cover capturing and analyzing CPU captures for the pods and troubleshooting memory leaks using tools like dotnet-gcdump and dotnet-dump.
To troubleshoot the pods running in the cloud, you'll need to interact with the Kubernetes cluster using the kubectl tool.
You can get a kubeconfig with the following commands:
# Get the kubeconfig for the target environment
MyProject$ metaplay get kubeconfig ENVIRONMENT -o my-kubeconfig

# Use the generated kubeconfig with kubectl
# On Linux/Mac
export KUBECONFIG=$(pwd)/my-kubeconfig
# On Windows Command Prompt
set KUBECONFIG=%cd%/my-kubeconfig
# On Windows PowerShell
$env:KUBECONFIG="$(pwd)\my-kubeconfig"
The generated my-kubeconfig uses the Metaplay CLI binary metaplay to authenticate to the cluster, so the authentication will be valid for as long as the CLI session lasts.
You can list the game server pods in an environment with:
kubectl get pods -l app=metaplay-serverYou can run a shell in a target game server pod using the CLI. This will spawn a Kubernetes ephemeral diagnostics container within the target pod. The game server container image itself does not have a shell for security reasons.
MyProject$ metaplay debug shell [ENVIRONMENT] [POD]You can run the following command to start a Kubernetes ephemeral diagnostics container against one of the server pods:
kubectl debug <pod-name> -it --profile=general --image metaplay/diagnostics:latest --target shard-server
# For example:
kubectl debug all-0 -it --profile=general --image metaplay/diagnostics:latest --target shard-server
This gives you a shell that can access the running server process. The metaplay/diagnostics image contains various diagnostics tools to help debug the server's CPU or memory consumption, including the .NET diagnostics tools, Linux perf, curl, and others.
The container automatically detects which user is running the target server process: app for chiseled base images and root for classic base images. A shell is opened for that user so that the .NET diagnostics tools work without further tricks. The shell starts in the /tmp directory as all users can write files there.
Note
Starting from Release 28, Metaplay uses the chiseled .NET base images, which are distroless and contain no shell, so an ephemeral container needs to be used. The distroless images are considered much safer as their attack surface is substantially smaller than that of a full OS image.
Compatibility Note
Depending on the infrastructure version, the target container name may be metaplay-server instead of shard-server. If kubectl debug gives an error message of a missing target container, try again with --target metaplay-server.
Run the following command to copy a file from a pod to your local machine:
kubectl cp <pod-name>:<path-to-file> ./<filename>
# For example:
kubectl cp all-0:/tmp/some-diagnostic-file ./some-diagnostic-file

# To copy a file from the `kubectl debug` debug container:
kubectl cp <pod-name>:<path-to-file> ./<filename> --container <debugger-container-id>
# For example:
kubectl cp all-0:/tmp/some-diagnostic-file ./some-diagnostic-file --container debugger-qqw2k
Note
The file system on the containers is ephemeral and gets wiped out if the container is restarted. If you perform diagnostics operations that generate any files you'd like to keep, you should retrieve them immediately to your local machine to avoid accidentally losing them.
Unreliable Error Messages
If the source file does not exist, kubectl cp does not always print an error message and instead silently completes. Due to the ephemerality of the source filesystem, always copy files to a new file name or delete the destination file first to avoid using data from an earlier kubectl cp call.
Taking heap dumps of the game server binary can take a long time, during which the game server is completely unresponsive. This causes the Kubernetes liveness probes to fail which leads to the container getting killed by Kubernetes after enough probe failures (around 30sec by default).
To work around this issue, you can bypass the health probe by setting them into an override mode where a success value is returned by a proxy sitting in front of the game server. You can set the override mode with:
curl localhost:8585/setOverride/healthz?mode=SuccessRequired Helm chart version
The health probe proxy behavior is always enabled since metaplay-gameserver Helm chart v0.6.4.
With Helm chart versions v0.6.1 through v0.6.3, you can enable the health probe proxying by setting the value sdk.useHealthProbeProxy to true in your Helm values file.
The override is applied for 30 minutes after which is returns to normal behavior, i.e., forwarding the health probes to the game server process. You can explicitly remove the proxy override with the following:
curl localhost:8585/setOverride/healthz?mode=PassthroughDebugging crashed servers can be tricky in Kubernetes as, by default, the container restarts also cause the contents of the file system to be lost. This means that crash dumps written to the disk are also lost as the container restarts after a crash.
Metaplay configures a volume mount to be mapped onto the game server containers at /diagnostics, and core dumps are written there in case of server crashes. These volumes share the lifecycle of the pod, as opposed to the container. Thus, the core dumps are retained over server restarts and can be retrieved for debugging purposes.
You can retrieve the core dumps with kubectl:
kubectl cp <pod-name>:/diagnostics/<file> ./core-dump
# For example:
kubectl cp all-0:/diagnostics/<file> ./core-dump
To analyze the heap dump, you can use the interactive analyzer:
dotnet-dump analyze <dump-path>See .NET Guide to dotnet-dump on how to use dotnet-dump to analyze the core dump.
You can use the /diagnostics directory for your own purposes as well if you need storage that is slightly more persistent than the regular container file system.
Note that rescheduling the pod, either due to deploying a new version of the server or, for example, due to a failed EC2 node, results in the volumes being lost and any crash dumps along with them.
The .NET performance counters are a good troubleshooting starting point and give a good overview of the health of the running pod.
View the performance counters with the following:
# Find the PID of the running server
dotnet-counters ps
# Monitor PID 100
dotnet-counters monitor -p 100
Here are some good overall indicators to check and see if the following counters are within reasonable limits:
You can also take a look at the Dotnet Diagnostic Tools CLI Design page from the .NET Diagnostics repository for an overview of the .NET troubleshooting tools available.
You can easily get a CPU capture using the CLI:
MyProject$ metaplay debug collect-cpu-profile [ENVIRONMENT] [POD]This will output a trace file named profile-<timestamp>.nettrace on your local machine.
You can use the dotnet-trace command to collect a CPU profile from the game server. Here we're collecting it from a 30-second interval.
# Find the PID of the running server
dotnet-trace ps
# Collect from PID 100
dotnet-trace collect -p 100 --duration 00:00:00:30
This will output a file called trace.nettrace. To retrieve the file to your local machine, use the following:
# Note: File is written to the debug container's filesystem
kubectl -n <namespace> cp <pod-name>:<path>/trace.nettrace ./trace.nettrace --container <debugger-container-id>
# For example:
kubectl -n lovely-wombats-build-quickly cp all-0:/tmp/trace.nettrace ./trace.nettrace --container debugger-qqw2kdotnet-trace convert <tracefile> --format Speedscope to convert the image to Speedscope format, which generates a JSON file that you can open in https://www.speedscope.app/.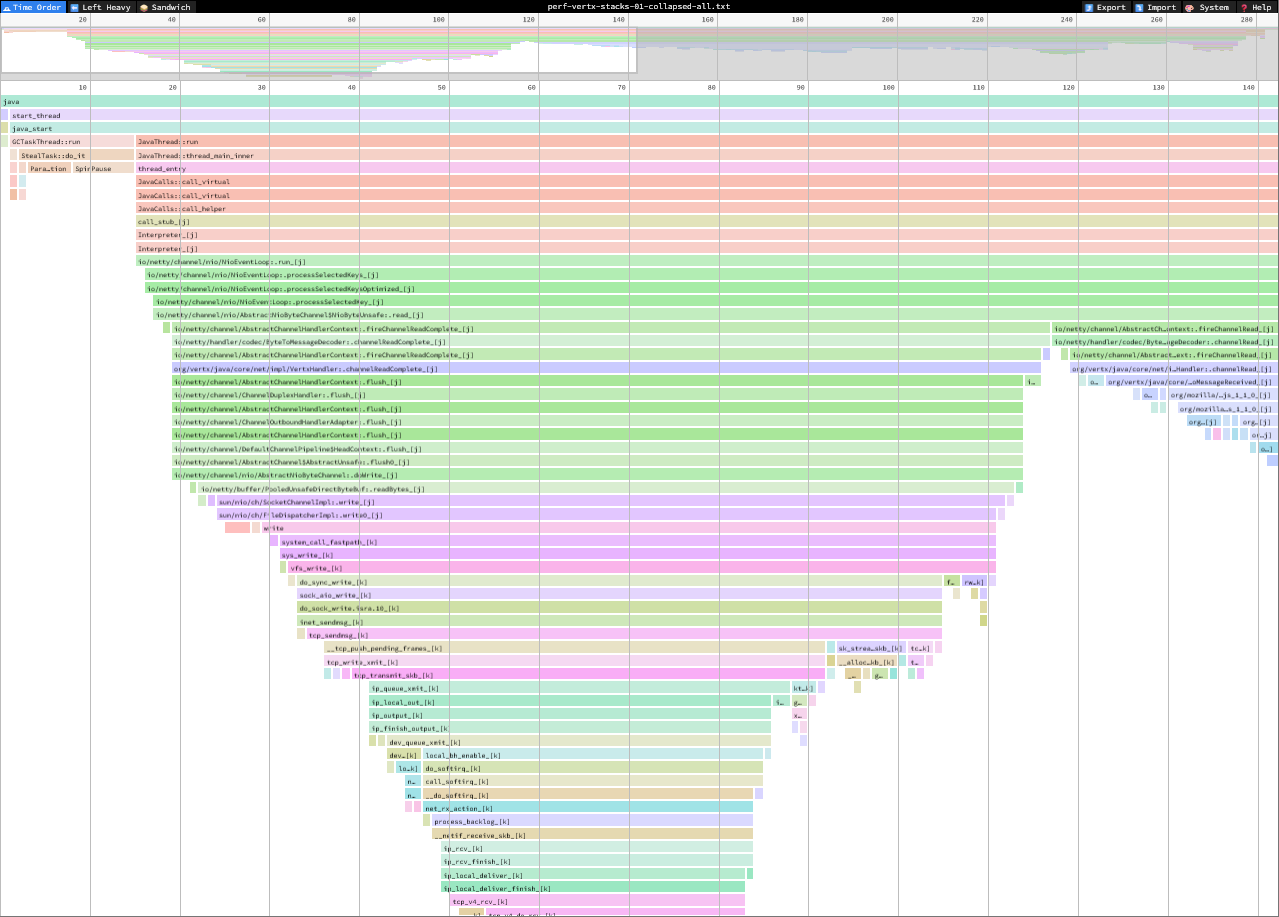
Note that by default, Speedscope only shows a single thread. You can switch threads from the top-center widget. There are a few different views available. The Left Heavy view is good for getting overall CPU usage, and the Time Order view is good for analyzing short-term spikes.
Pro tip!
You can check out the Dotnet Docs if you want to dive a little deeper into the Dotnet Trace tools.
The recommended way to trace memory leaks is to start with a load testing run on your local machine:
dotnet-gcdump or dotnet-dump. The next section goes into detail about which tool to use and how to use them.Danger!
Collecting a memory dump with either dotnet-gcdump or dotnet-dump can take a long time, and the server process is completely frozen during the operation. This will pause the game for all the players, and possibly kick out the players if the heap dump takes tens of seconds.
Due to the intrusive nature of the taking a heap dump in production, the best time to take a heap dump is during a maintenance break, between enabling maintenance mode and re-deploying the game server. This minimizes the intrusions on your players and gives the cleanest heap dump.
Follow the steps below:
Set the game server into maintenance mode.
Wait for a few minutes to let all the server drain all the in-memory actors and caches.
By draining the actors, the heap dump should have much less noise and thus be easier to analyze.
Take the heap dump & copy the file to your local system. See detailed instructions below.
If the heap is large enough (generally multiple gigabytes), the operation can take long enough for the Kubernetes health checks to consider the container unhealthy and restart it. Please see Health Probe Overrides on how to prevent this from happening.
Continue by deploying the game server.
Note that this step cleans up any memory leaks within the process so you must take the heap dump before deploying the server.
dotnet-gcdump vs dotnet-dump In general, if you have access to a Windows machine, you should start with dotnet-gcdump:
gcdump supports macOS).See .NET Diagnostics Tools: dump vs. gcdump for a more detailed comparison between the two and detailed instructions on using each.
You can use the metaplay debug collect-heap-dump command to collect a heap dump from the game server.
To use the dotnet-gcdump tool (default):
MyProject$ metaplay debug collect-heap-dump [ENVIRONMENT] [POD]This will output a file called dump-<timestamp>.gcdump on your local machine.
To analyze the heap dump, you can drag the file into Visual Studio to open it or open the file in PerfView.
To use the dotnet-dump tool:
MyProject$ metaplay debug collect-heap-dump [ENVIRONMENT] [POD] --mode=dumpThis will output a file called core_<timestamp> on your local machine.
dotnet-gcdump In the cloud, the diagnostic docker image comes with the tool pre-installed. To install the tool locally, you can run the following command on your machine:
dotnet tool install -g dotnet-gcdumpFirst, collect a heap dump from the server process.
# Find the PID of the running server
dotnet-gcdump ps
# Use the tool on PID 100
dotnet-gcdump collect -p 100
This will create a file named something like 20240325_095122_28876.gcdump. To retrieve the file from the Kubernetes pod, run the following:
# Note: File is written to the debug container's filesystem
kubectl cp <pod-name>:<path>/<filename> ./<filename> --container <debugger-container-id>
# For example:
kubectl cp all-0:/tmp/20240325_095122_28876.gcdump ./20240325_095122_28876.gcdump --container debugger-qqw2k
To analyze the heap dump, you can drag the file into Visual Studio to open it or open the file in PerfView.
dotnet-dump The dotnet-dump tool can be used to collect and analyze full memory dumps of a running process. Analyzing the dump must happen on the same OS where the dump originated, so a Linux machine is required to analyze dumps from docker images running in Kubernetes clusters.
In the cloud, the docker images have the tool pre-installed. Alternatively, you can run the following command to install the tool locally on your machine:
dotnet tool install -g dotnet-dumpFirst, collect a heap dump from the server process.
# Find the PID of the running server
dotnet-dump ps
# Use the tool on PID 100
dotnet-dump collect -p 100
This will create a file named something like dump_20240325_095609.dmp. To retrieve the file from the Kubernetes pod, run the following:
kubectl cp <pod-name>:<path>/xxxxx.dmp ./xxxxx.dmp
# For example:
kubectl cp all-0:/tmp/xxxxx.dmp ./xxxxx.dmp
To analyze the heap dump, you can use the interactive analyzer.
dotnet-dump analyze <dump-path>Here are some useful commands for a good starting point:
dumpheap -stat shows an overview of what consumes memory.dumpheap -mt <MT> shows all entries of a given type (get using dumpheap -stat).dumpheap -type System.Byte[] -min 1024 shows all byte arrays that are 1kB or larger.dumpobj <address> shows information about the given object at <address>.gcroot <address> finds the chain of references to a given object. It is useful to find where a leaked reference is coming from.These are some resources you can use to learn more about these tools and how to use them effectively:
The LLDB debugger can be used to dig deeper into the memory heap dumps. You can use it to dump aggregate amounts of memory used by types and trace the object graph to understand which objects are referenced by whom.
Take a look at the following articles for more information:
This slide presentation by Pavel Klimiankou also has some useful insights about using Perfview, LTTng, and LLDB: https://www.slideshare.net/pashaklimenkov/troubleshooting-net-core-on-linux