Appearance
Troubleshooting
This page describes how and where to look when your game server is down or not responding.
Appearance
This page describes how and where to look when your game server is down or not responding.
If your game server is down or not responding, there are measures you can take to figure out why. In this page, we'll discuss some common approaches and tools to help you troubleshoot issues with your game server.
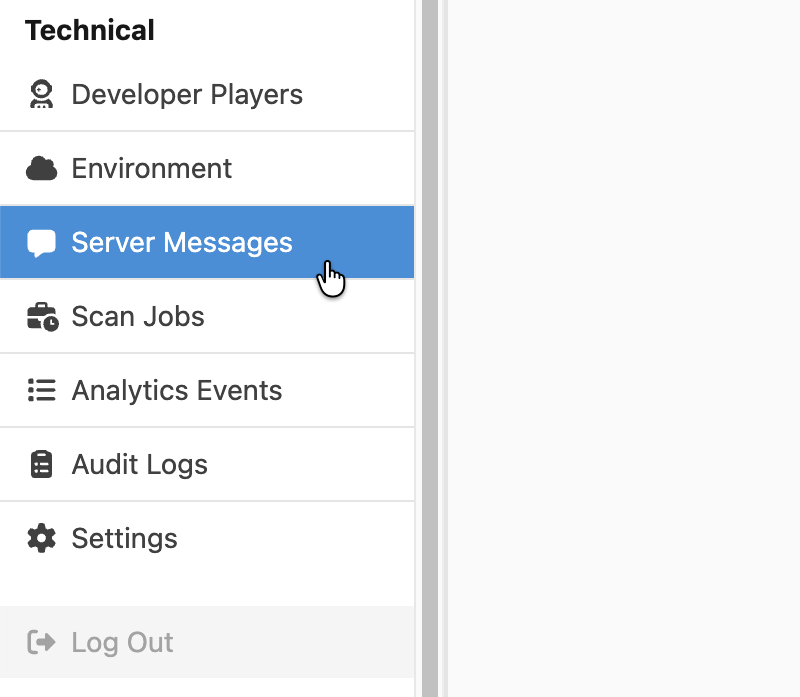
The LiveOps Dashboard will keep track of any non-fatal errors the server encounters. You can find these errors under the "Server Messages" menu item.

The dashboard only keeps track of the last 100 errors that occurred during the last 5 days, and they're cleared when the server restarts. The Logs keep a longer history and offer more filtering and searching options. To ensure your server keeps running smoothly, you should keep an eye on these errors and try to resolve any that come up.
The Metaplay SDK provides a powerful built-in incident report system that covers most cases where you would want to record problems on the client, including networking issues, unhandled exceptions, and more. Furthermore, the SDK also supports game-specific incident reports. You can find out more on the Implementing Custom Incident Reports page.
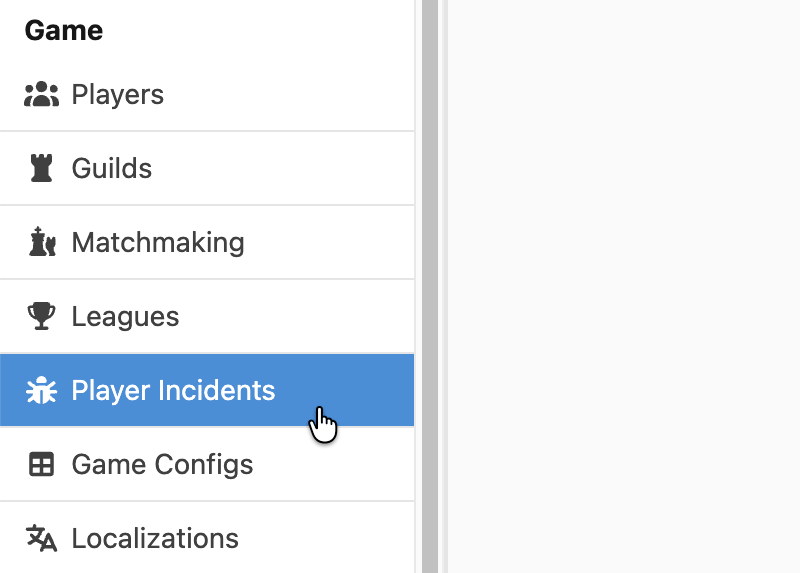
You can find these reports under the dashboard's Player Incidents menu item or in Player Details under the Technical tab.

Each environment comes with a Grafana instance to track metrics and logs. In Metaplay-hosted environments, this is by default available on the {environment-id}-admin.p1.metaplay.io/grafana URL. You can also find links to it from Metaplay Portal on the Environment Details page.
INFO
An environment id is the static identifier for your environment; it does not change even if the name of the environment changes. You can find the environment id on the Environment Details page from Metaplay Portal, where the id is to the right of the environment name.
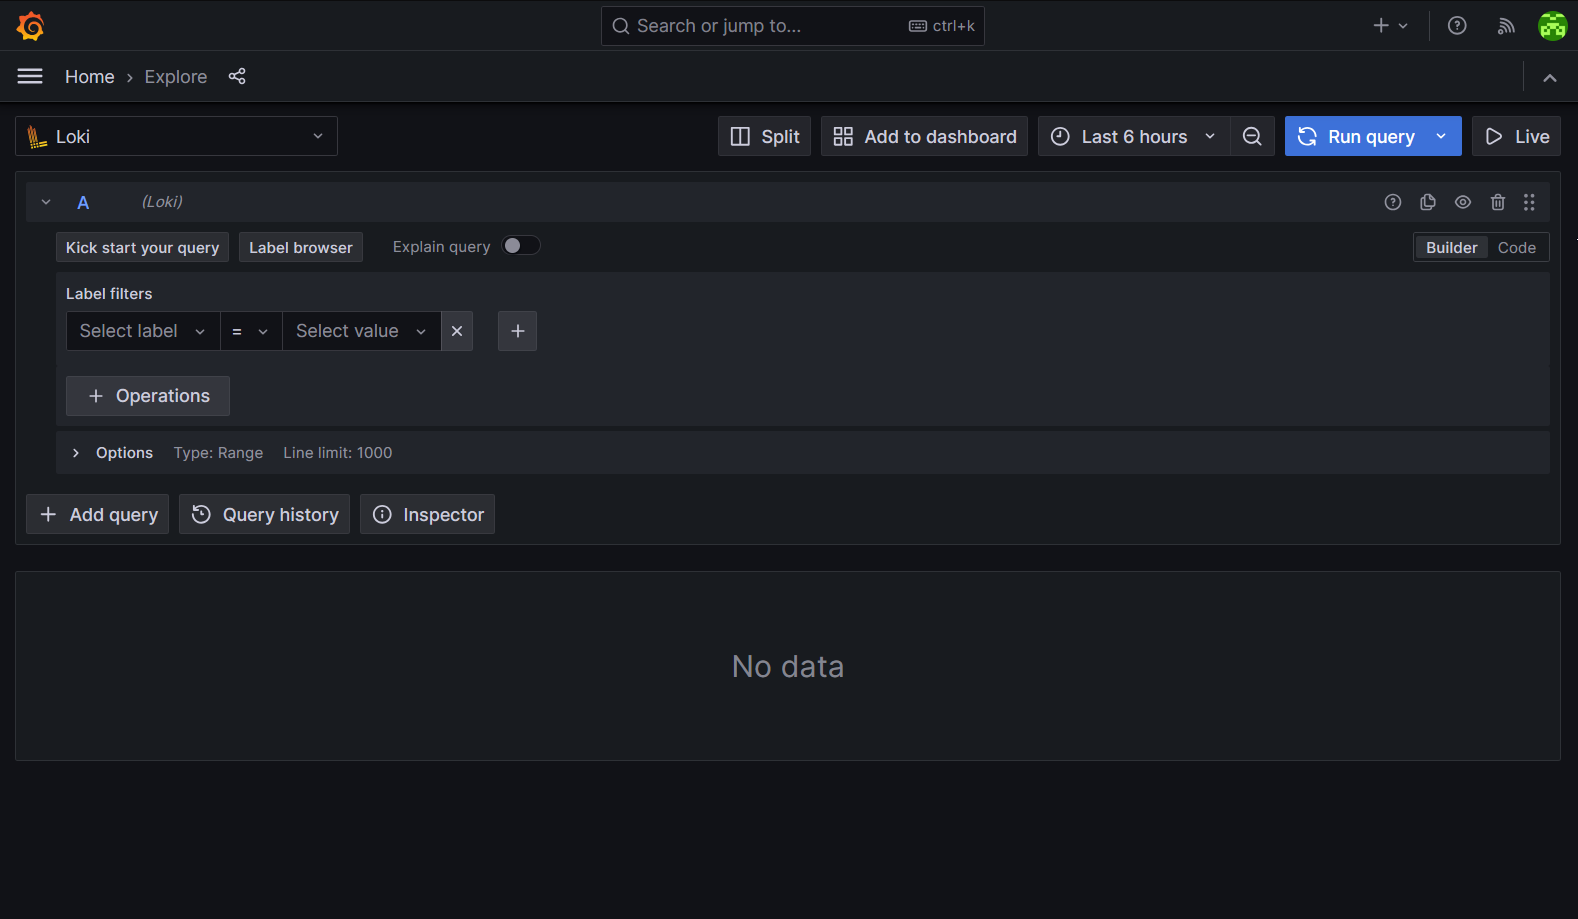
Logs can be found in the sidebar under the "Explore" item.

Select app in the label dropdown and metaplay-server in the value dropdown, press Run Query, and you should start seeing your logs. There are many filtering options available, from log levels to text filters (does the log contain a keyword). You can play around with different settings to get comfortable.
Building search queries through text is possible by changing the mode on the right side from Builder to Code. This is especially useful to save and re-use search queries. Here are a few useful ones to get you started:
{app="metaplay-server", loglevel="WRN"}You can also pass ERR, INF, and DBG as the value for loglevel.
{app="metaplay-server"} |= `SEARCH QUERY`Replace SEARCH QUERY with your own string.
{app="metaplay-server"} |~ `REGEX QUERY`Replace REGEX QUERY with your own regex.
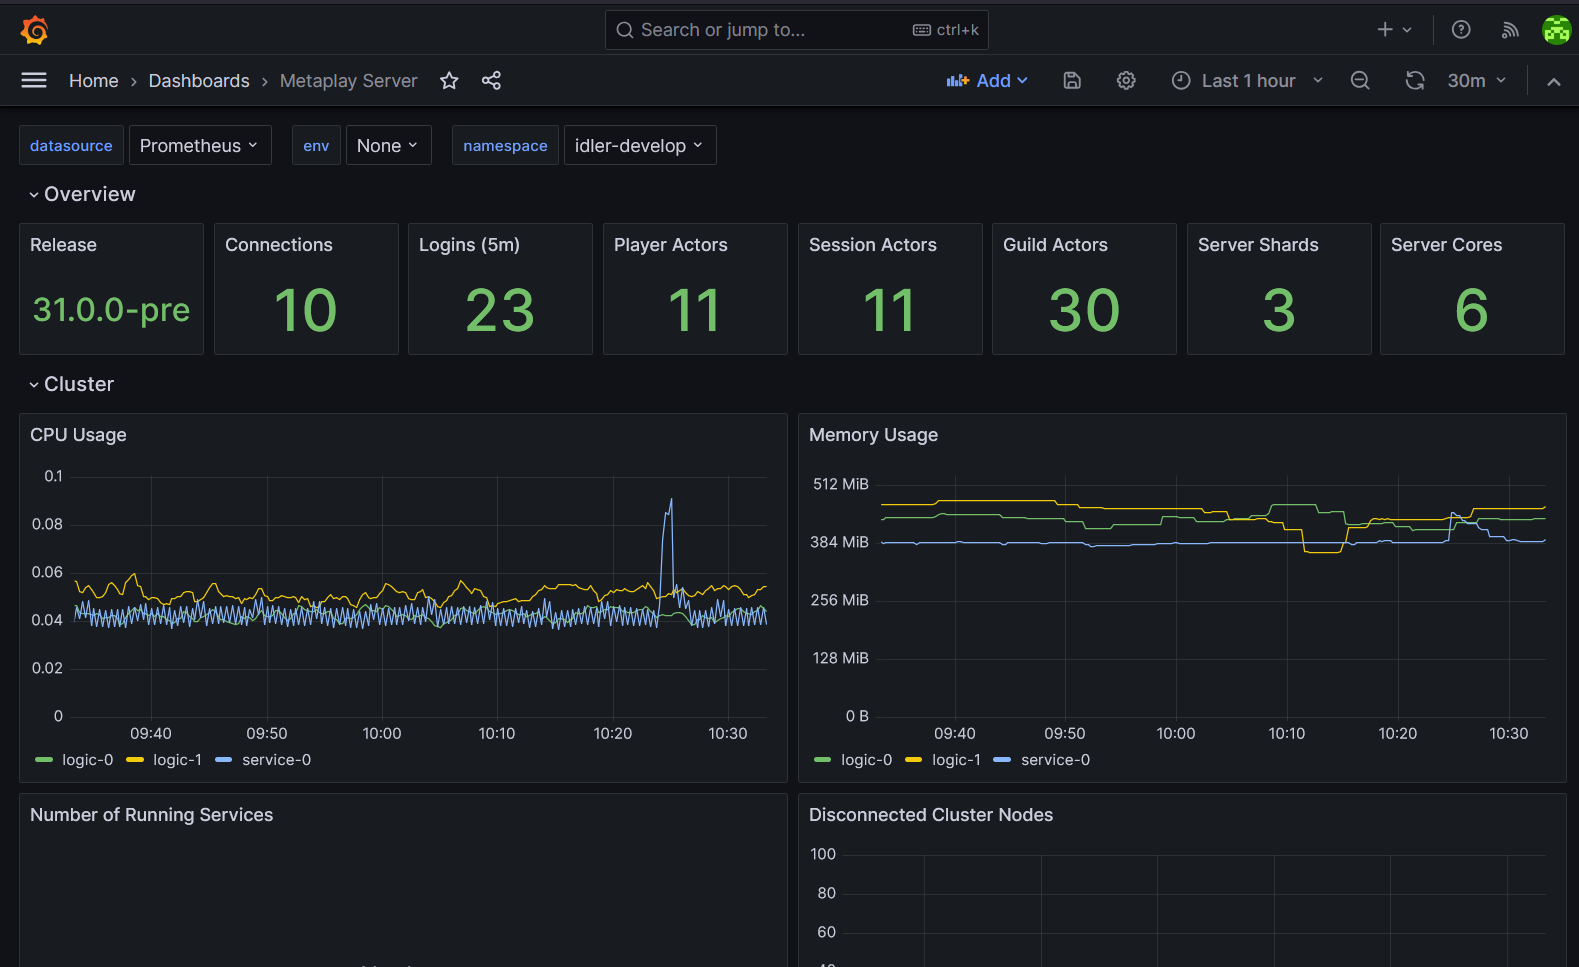
The metrics can be found under the Dashboards menu item. You'll find a page that lists all available dashboards. Currently, we only ship Metaplay Server by default; this contains most of the common metrics (e.g., CPU usage, memory usage, current player count, login rate) that you might be interested in to monitor the health of your server.

Most often, 503 errors are caused by errors during the startup process, either from a configuration issue or unexpected exceptions. You can check the Logs to find out what happened. Often you'll quickly find the exception that is causing the server to fail to launch. However, if it's not immediately clear, the first message that the server logs starts with Launching application. Try to find when the server started and look at the logs shortly after to see what is happening.
💡 Pro tip
The latest version of our CI scripts will automatically detect if the game server fails to start, providing useful debugging information and logs to your CI pipeline!
First, verify that you are connecting to the right environment. The Environment Configs Editor Window can be used to change the environment that you're targeting.
Once you're sure that you're connecting to the right environment, take a look at the console logs in Unity and check the server logs; often, they have good hints about why the connection is failing.
In builds, you can't easily check what environment you're connecting to; therefore, you have to check the logs from the build. This depends on what platform you're running on. The Unity Docs has more info on how to read logs from different platforms. When the game client connects to a server, we log a message that starts with Opening connection to, followed by the hostname or an IP address. Verify that the hostname or IP address matches the environment that you're trying to connect to.
Next, take a further look at the game client logs for any errors or unexpected messages; often, connection failures will log info on the client.
If the client logs don't give any useful hints, you can check the server logs as described in the Logs section.
Lastly, an incident report might be logged for connection failures; take a look at the Incident Reports section in the Dashboard.
Although we always try our best to keep any game servers running in Metaplay Cloud to be healthy 24/7, it's possible that there is an outage going on which is out of your control. Metaplay will keep the Service Status page updated with any known issues. If you think there is an outage going on that is not currently reported, please contact Metaplay support.
Now that you have a handle on the basics of troubleshooting, you should be able to get over most issues you might encounter when getting started with Metaplay.
For more advanced game server troubleshooting needs, such as CPU profiling or debugging memory leaks, take a look at the Troubleshooting Servers guide.