
Appearance
Skip to content This section provides an overview of the tools and their configurations for interacting with infrastructure and game server logs.
Tools
The main tools we use are:
- fluent-bit: used for monitoring and sending logs from Kubernetes nodes as well as containers running on those nodes.
- Loki: an in-cluster log aggregation tool for collecting and allowing querying of logs. Can be queried either directly using the APIs and LogQL or via a separate UI such as Grafana.
- Grafana: used as a common frontend for querying and interacting with logs (as well as other metrics and dashboards).
- CloudWatch Logs: An Amazon Web Services (AWS) service for collecting logs. Most other AWS services offer native integration to send logs to CloudWatch.
- S3: An AWS service for object storage, used often for persisting logs (e.g. via Loki or directly from fluent-bit).
Overview of logging
Sources of logs and gathering log data
Logging is a broad subject and in the context of running Metaplay-based game servers and supporting infrastructure, we can roughly categorize sources of log data into the following categories:
- Docker containers
- Game servers and supporting tooling orchestrated via the metaplay-gameserver Helm chart
- Kubernetes cluster-wide tooling via the metaplay-services Helm chart
- Virtual machines
- EC2 instances which make up the nodes of the Kubernetes cluster
- AWS services
- Elastic Kubernetes Service (EKS): Kubernetes control plane related logging
- Lambda: Various utility functions
Each of these sources behaves slightly differently and utilizing and capturing logs is handled by default different. For example, many AWS services themselves can be configured to publish logs to AWS CloudWatch Logs, where the logs can be persisted or consumed from. As a practical example, AWS EKS control plane logs are published to CloudWatch Logs in this way. In practice for many AWS services we not only do not need to, but often cannot actually influence that much in how the logs are gathered.
On the other hand, most components of the Metaplay stack are run as Docker containers on top of EKS. This means that the logs that are output by the containers are generated and exist mainly in the context of the underlying Kubernetes node, which runs those containers. In our case these hosts are often AWS EC2 instances. In these cases we leverage tools like fluent-bit, which is run on each host as a Kubernetes DaemonSet, and rely on these tools to monitor the host's /var/log directory and capture all logs being output by the containers on the given host. Fluent-bit can be used to additionally decorate each gathered log row with metadata, such as which Kubernetes pod and which container in the pod generated the log row. Collecting this type of data allows easier consumption of logs further down the line.
In practice we prefer to collect Kubernetes logs in this fashion as it means we do not need to customize the log collection per-service, but instead can easily collect logs of all containers, be they long running services or ephemeral jobs, in this fashion.
Aggregating logs
Once logs are gathered, we by default aggregate them to two different locations:
- CloudWatch Logs
- Loki
Functionally, log aggregation allows us to define a central location where the log data is collected to, and which solves issues like how the log data is persisted and how it can be interacted with or queried.
As discussed above, CloudWatch Logs offers a logical location for us to aggregate AWS-native logging data to. We attempt to segregate services into different CloudWatch Logs log groups based on logical components (e.g. EKS logs go to a different log group than Lambda function logs), and within those log groups we attempt to split logs into log streams based on further logical groupings within the component (e.g. within the EKS log group, different log streams exist for the Kubernetes API server, authentication service, controller manager, etc.).
For logs originating from Kubernetes nodes via fluent-bit, we by default use Grafana Labs' Loki as the aggregator. Our current design runs Loki in-cluster and using AWS S3 for persistence of log files. Unlike CloudWatch Logs, which is an AWS PaaS, Loki requires more operational caretaking, especially in large deployments, and the later parts of this document will outline various strategies available to help with scaling Loki up if log volumes increase.
Consuming logs
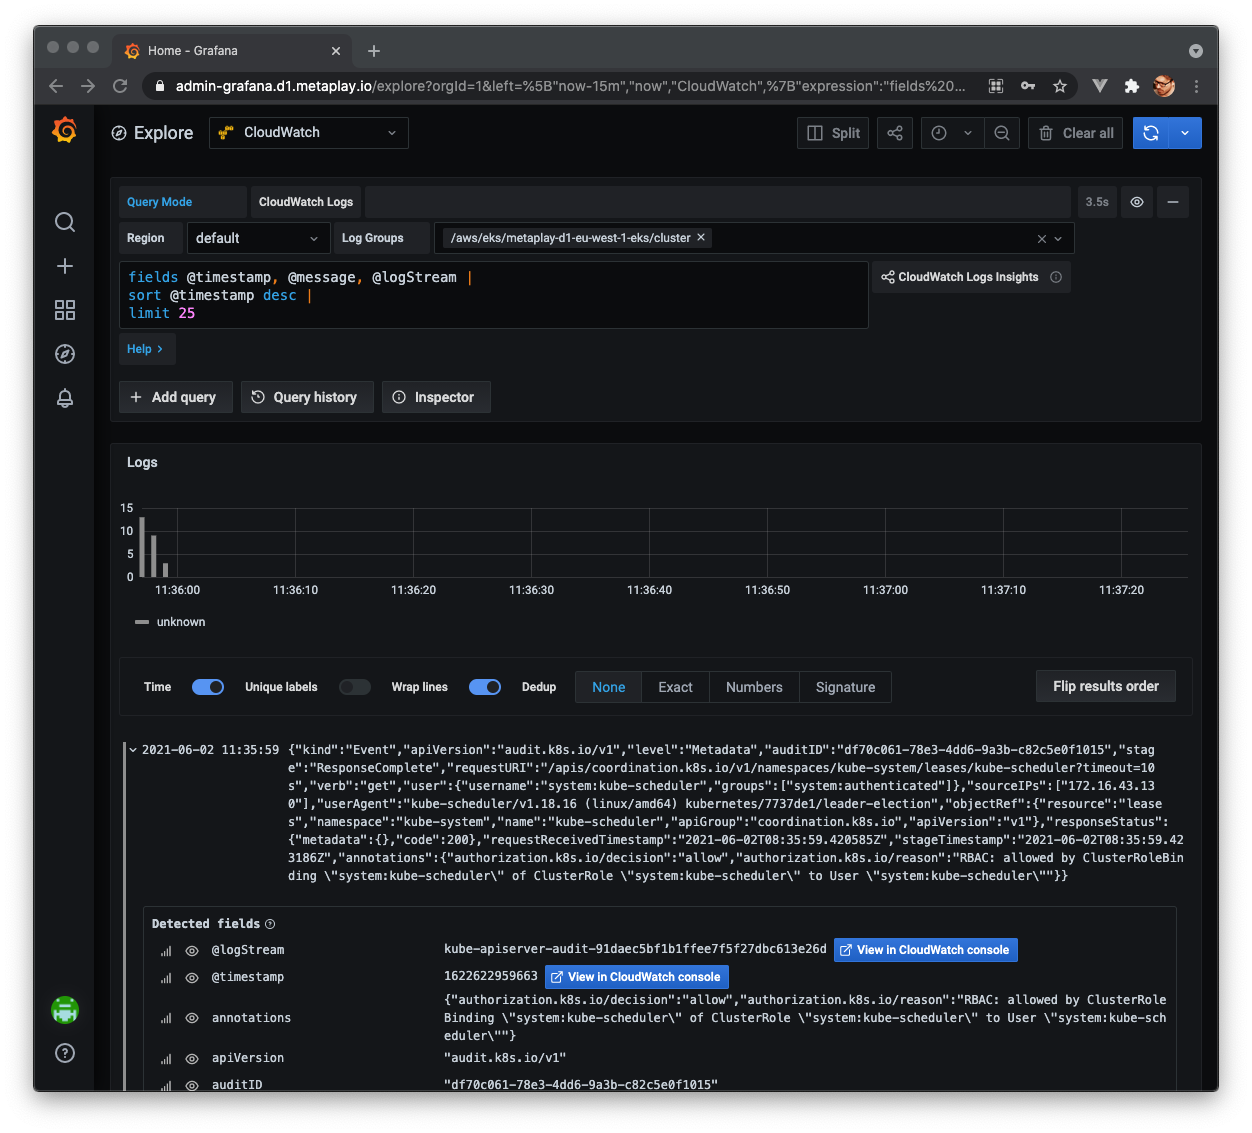
As an end user of logs, regardless of whether you are a game server developer or an operations engineer looking after the infrastructure, our base design places Grafana as the central source of not only metrics, but also log data. You can think of Grafana as a lens to these different troves of data and offers a unified location for you to query logs from, or even create dashboards based on log analysis.
Each log aggregator has a slightly different format for querying data. Listed below are links to resources for getting acquainted with querying Loki using LogQL or AWS CloudWatch Logs using the CloudWatch Logs Insights queries:
Other log sinks
Besides the aforementioned flow of logs, our design supports the possibility for you to decide to send logs to other external aggregators (e.g. Elasticsearch, Splunk, New Relic or Datadog) or to storage systems (e.g. AWS S3, Azure Blob) by extending the fluent-bit configurations. This means that you can, if you wish, opt out of the above flow and utilize any other tooling that you may want to use.
Configuring your infrastructure for logging
Basic configuration to get the flow going
Assuming that you manage your infrastructure through the Metaplay-provided Terraform modules, configuring a basic logging setup is relatively straightforward. The environments/aws-region` module README is a good place to get started with to understand which parameters are available to you. That said, to get started, we can configure our environment as follows:
bash
module "infra" {
  source = "git@github.com:metaplay/infra-modules.git//environments/aws-region?ref=v0.1.4"

  # Snip, your other configurations are here...

  fluent_bit_enabled = true

  loki_enabled                   = true
  loki_aws_storage_enabled       = true
  loki_aws_storage_allow_destroy = true
}
The above example explicitly enables both fluent-bit and Loki (they are enabled by default, so technically they would not need to be called out). Additionally we allow the creation of an S3 bucket that Loki can persist log data to using the loki_aws_storage_enabled parameter. This allows for easy storage of larger amounts of log data than if the data was only stored ephemerally inside the cluster's own storage. We additionally flag loki_aws_storage_allow_destroy to allow for Terraform to clear the contents of the Loki S3 bucket when terraform destroy is run. This is convenient for development environments, but should be set to false in production environments where you do not even accidentally want to destroy historical log data.
With the above setup in deployed and in play, you can already access container logs via Loki using Grafana's Explore section and selecting Loki as the data source.
Scaling up Loki
If the volume of your game grows, it is possible to hit the limits of the above basic setup with Loki quite easily. Typically this will manifest itself as Loki potentially becoming unresponsive when being queried or the general load of the cluster being significantly increased.
In these cases we can apply a couple of different tactics to allow for Loki to scale up:
- Increase the number of Loki replicas to allow for more bandwidth to ingest incoming log data
- Increase the number of Loki reader replicas to allow for more capacity when querying Loki
- Ensuring that Loki query-frontend is enabled with sufficient replicas to allow long queries to be carved into smaller queries and distributed across multiple Loki reader replicas
- Move Loki pods to dedicated Kubernetes nodes to reduce risk of situations where high Loki resource usage might adversely affect other payloads running in the cluster
- Move Lokis pods to be run on EKS Fargate to allow for similar separation as tactic 4
The above tactics 1-4 can be implemented via the Terraform module using the following configurations:
bash
module "infra" {
  source = "git@github.com:metaplay/infra-modules.git//environments/aws-region?ref=v0.1.4"

  # Snip, your other configurations are here...

  fluent_bit_enabled = true

  loki_enabled                   = true
  loki_aws_storage_enabled       = true
  loki_aws_storage_allow_destroy = true

  **loki_replicas                  = 2 # tactic 1
  loki_reader_replicas           = 3 # tactic 2**

  **# tactic 3
  loki_queryfrontend_enabled     = true
  loki_queryfrontend_replicas    = 1**

  **# tactic 4
  loki_shard_pool               = "logging"
  loki_reader_shard_pool        = "logging"
  loki_queryfrontend_shard_pool = "logging"

  shard_node_pools = {
    # Snip, your pre-existing shard node pool configurations, make sure that all pool spec keys exist...
    logging = {
      pool_size     = 3 # initial pool size of 6 (= 3*length(logging.azs))
      pool_min_size = 1
      pool_max_size = 10
      autoscaler    = true
      instance_type = ["c5.large"]
      azs           = ["eu-west-1a","eu-west-1b"]
    }
  }**
}
Tactic 4 of separating the Loki pods to a separate Kubernetes node pool is especially wise in production environments to limit the blast radius and safe guard the operations of the rest of the cluster even if Loki gets overwhelmed. In the example above we have defined a new shard node pool named logging, which is guaranteed to not run any other pods than the ones that explicitly request to be run in the pool. Using the _shard_pool parameters we tell which Loki components we want to schedule there. We also enable the autoscaler to manage the pool for us, which makes it easier in the future to just adjust the _replicas numbers as needed and the pool will dynamically adjust accordingly.
On a very technical level, Loki is being deployed by the Terraform module using the metaplay-services Helm chart. The chart is designed to prefer Loki pods to be scheduled away from each other, if possible. This will mean that as long as there is a sufficient amount of underlying nodes available, Kubernetes will attempt to distribute the pods correspondingly away from each other.
Running Loki pods on EKS Fargate
DANGER
This approach is still slightly experimental, so beware of dragons!
Tactic 5 is an alternative to tactic 4, achieving fundamentally the same thing but using the AWS EKS Fargate profile approach to allow the Kubernetes scheduler to schedule Loki pods to run on Fargate, instead of on the EC2 nodes. The benefit from this is that there is no need to mess around with underlying node infrastructure. The downside is that Fargate-based pods are charged separately based on Fargate pricing and tend to be typically more expensive than running pods on EC2 nodes.
That said, we can adjust the configuration of Loki as presented below to target deployments into Fargate:
bash
module "infra" {
  source = "git@github.com:metaplay/infra-modules.git//environments/aws-region?ref=v0.1.4"

  # Snip, your other configurations are here...

  fluent_bit_enabled = true

  loki_enabled                   = true
  loki_aws_storage_enabled       = true
  loki_aws_storage_allow_destroy = true

  loki_replicas                  = 2 # tactic 1
  loki_reader_replicas           = 3 # tactic 2

  # tactic 3
  loki_queryfrontend_enabled     = true
  loki_queryfrontend_replicas    = 1

  # tactic 5
  fargate_profiles = {
    loki = {
      namespace = "metaplay-system"
      labels = {
        app     = "loki"
        release = "metaplay-services"
      }
    }
    loki-reader = {
      namespace = "metaplay-system"
      labels = {
        app     = "loki-reader"
        release = "metaplay-services"
      }
    }
  }
}
What we specifically do here is tell the AWS EKS scheduler that any pods which are in the configured namespaces and have the corresponding labels should be scheduled to corresponding Fargate profiles. In our case above we know that our Loki pods tend to have the app label of either loki or loki-reader, and that we have a release label with the value of metaplay-services. We additionally know that the pods will exist in the metaplay-system namespace. Putting all these together allows us to target specifically these pods for Fargate execution.
Note that if you apply this configuration change to an already existing cluster, you may need to kill the individual Loki pods to get them to be rescheduled to Fargate, if they are already currently running on EC2 nodes.
Sending Kubernetes logs to S3 or CloudWatch Logs
We offer the possibility of easily sending logs directly from fluent-bit over to either S3 or CloudWatch Logs. If you wish, you can use this to bypass Loki altogether and send logs directly to AWS PaaS systems. This can be done with the Terraform module parameters:
bash
module "infra" {
  source = "git@github.com:metaplay/infra-modules.git//environments/aws-region?ref=v0.1.4"

  # Snip, your other configurations are here...

  fluent_bit_enabled = true

  fluent_bit_s3_enabled       = true
  fluent_bit_s3_create_bucket = true # allow Terraform to manage the S3 bucket
  fluent_bit_s3_force_destroy = true # allow Terraform to destroy the bucket even if it has content

  fluent_bit_cloudwatch_enabled        = true
  fluent_bit_cloudwatch_retention_days = 30 # retain logs for only 30 days

  # deactivate Loki if it is not needed
  loki_enabled = false
}
You can find additional parameters from the components/aws-region` module README.
If you wish to manage the S3 bucket yourself (for example if you want to enforce bucket life cycle policies or similar), you can also do that:
bash
resource "aws_s3_bucket" "logs" {
  bucket = "my-logs-bucket"
  acl    = "private" # don't allow outside access

  lifecycle_rule {
    id     = "logs"
    enable = true

    # after 30 days change objects to infrequent access mode to save on storage costs
    transition {
      days          = 30
      storage_class = "STANDARD_IA"
    }

    # after 60 days transfer objects to AWS Glacier to save even more
    transition {
      days          = 60
      storage_class = "GLACIER"
    }

    # after 90 days just remove objects
    expiration {
      days = 90
    }
  }
}

module "infra" {
  source = "git@github.com:metaplay/infra-modules.git//environments/aws-region?ref=v0.1.4"

  # Snip, your other configurations are here...

  fluent_bit_enabled = true

  fluent_bit_s3_enabled = true
  fluent_bit_s3_bucket  = aws_s3_bucket.logs.id

  # deactivate Loki if it is not needed
  loki_enabled = false
}
Sending Kubernetes logs to any other location
We also recognize that you may have a need to send logs to any number of third party systems. Our approach is to give you the flexibility of configuring fluent-bit to achieve this, assuming that available plugins exist. If the fluent-bit ecosystem does not have suitable plugins available, we also provide you with the possibility of opting out of all of the logging infrastructure and you can easily roll your own.
Custom fluent-bit outputs
Fluent-bit has an extensive amount of plugins available out of the box, which can be configured using the Terraform module passthroughs. You can check documentation on the output plugins in the fluent-bit documentation.
For example, if we decided that we'd like to send all of our Kubernetes container logs over to New Relic, we could inject our custom configuration in the following way:
bash
module "infra" {
  source = "git@github.com:metaplay/infra-modules.git//environments/aws-region?ref=v0.1.4"

  # Snip, your other configurations are here...

  fluent_bit_enabled = true

  # custom outputs
  fluent_bit_extra_outputs = <<EOF
[OUTPUT]
    match   kube.*
    name    nr_logs
    api_key YOUR_API_KEY_HERE
EOF

  # deactivate Loki if it is not needed
  loki_enabled = false
}
In addition to fluent_bit_extra_outputs, you can also inject custom configuration snippets to inputs, filters, and parsers via the fluent_bit_extra_inputs, fluent_bit_extra_filters and fluent_bit_extra_parsers parameters, respectively.
Rolling your own logging solution
DANGER
Please consult your logging vendor for details on how the installation is to be done. This section intends to only elaborate on how you can integrate other services to the Metaplay infrastructure stack.
In the event that you still find yourself limited by the above customizability, it is possible to turn off all of the above and inject your own system.
For example, if you wanted to roll your own setup using Helm charts and deploy it on the infrastructure, you could do something like the following:
bash
module "infra" {
  source = "git@github.com:metaplay/infra-modules.git//environments/aws-region?ref=v0.1.4"

  # Snip, your other configurations are here...

  # deactivate logging components altogether
  fluent_bit_enabled = false
  loki_enabled       = false

  # let's assume we have some shard_node_pools defined; we'll use these names later to add tolerations for fluent-bit
  shard_node_pools = {
    logic = {
      # ...
    }
    service = {
      # ...
    }
  }
}

# use the infra module outputs to obtain details about the Kubernetes cluster...
data "aws_eks_cluster" "cluster" {
  name = module.infra.cluster.cluster_id
}

# ... and get an authentication token for the cluster
data "aws_eks_cluster_auth" "cluster" {
  name = module.infra.cluster.cluster_id
}

# set up a Terraform Helm provider using the cluster details
provider "helm" {
  kubernetes {
    host                   = element(concat(data.aws_eks_cluster.cluster[*].endpoint, [""]), 0)
    cluster_ca_certificate = base64decode(element(concat(data.aws_eks_cluster.cluster[*].certificate_authority.0.data, [""]), 0))
    token                  = element(concat(data.aws_eks_cluster_auth.cluster[*].token, [""]), 0)
  }
}

# set up a Terraform Kubernetes provider using the cluster details
provider "kubernetes" {
  host                   = element(concat(data.aws_eks_cluster.cluster[*].endpoint, [""]), 0)
  cluster_ca_certificate = base64decode(element(concat(data.aws_eks_cluster.cluster[*].certificate_authority.0.data, [""]), 0))
  token                  = element(concat(data.aws_eks_cluster_auth.cluster[*].token, [""]), 0)
}

# create a new Kubernetes namespace for custom logging
resource "kubernetes_namespace" "my-logging" {
  metadata {
    name = "my-logging"
  }
}

locals {
  sumologic_values = {
    "accessId": "<SUMO_ACCESS_ID>"
    "accessKey": "<SUMO_ACCESS_KEY>"
    "clusterName": "my-metaplay-cluster"
    "metrics": {
      "enabled": false # we're only interested in the logs
    }
    "fluent-bit": {
      "tolerations": [ # we need to add tolerations for our shard node pools so that fluent-bit will run there
        {
          "effect": "NoSchedule"
          "key": "metaplay.io/shard-type"
          "value": "shard-logic"
        },
        {
          "effect": "NoSchedule"
          "key": "metaplay.io/shard-type"
          "value": "shard-service"
        },
      ]
    }
  }
}

# invoke the sumologic Helm chart using the values from above
resource "helm_release" "sumologic" {
  name       = "sumologic"
  repository = "https://sumologic.github.io/sumologic-kubernetes-collection"
  chart      = "sumologic"
  version    = "2.1.2"

  namespace = kubernetes_namespace.my-logging.metadata.name

  values = yamlencode({
    sumologic = local.sumologic_values
  })
}
The above pattern shows you have to use the infra module and data constructs to establish Helm and Kubernetes connections to the cluster that is provisioned through the infra module. Using these, you can deploy anything you need to deploy in the cluster. The example above is a simplified example of deploying a Sumologic Helm chart into the cluster in a custom namespace, but you can similarly deploy anything else you wish.
Experimental items and fine-tuning
Fluent-Bit and Loki
As of autumn 2021, Loki and fluent-bit support for Loki are in flux and can cause issues for infrastructure and deployments producing a large volume of logs. In infra-modules release v0.1.5 we have reverted to a setup where the following tested combination of components exists:
- Loki 2.3 - performance improvements compared to earlier version
- Custom packaged fluent-bit 1.8.3 - performance improvements compared to earlier version
- Additionally we ship Grafana Labs'
grafana-lokiplugin with this image. This is a more stable and proven plugin compared to thelokifluent-bit plugin, which we suggest SHOULD NOT BE USED.
- Additionally we ship Grafana Labs'
For upcoming releases, we will continue to track the situation as it evolves with an attempt to eventually make a safe migration to the official loki fluent-bit plugin when it is sufficiently matured. Additionally upcoming Loki versions (e.g. 2.4) promise improvements in robustness (e.g. removing requirement for submitting ordered logs, which is difficult for fluent-bit).
In the event that you want to run the less mature loki plugin, you can override the above defaults through Terraform by doing:
jsx
module "infra" {
  source = "git@github.com:metaplay/infra-modules.git//environments/aws-region?ref=v0.1.4"

  # ...

  fluent_bit_loki_grafana_labs_plugin = false # true by default
}